Many tasks have been made easier than ever for the configuration and maintenance of all the messaging between systems.
Few months ago, I showed how it can be set and used.
And even more, from the Peopletools 8.53, it was promised in the RVP that the monitoring could be automated through email:
“Automated Network Status and Real-Time Notification of Errors In PeopleTools 8.52, checking the status of PeopleSoft systems in the Integration Network was a manual process. Administrators could go to a page in the Integration WorkCenter and see the status of all connected systems. New in 8.53, checking the status is an automated process, and the results of the check can be sent directly to an administrator.
Once configured, the Integration Network can monitor itself for errors.”
So, I was expecting a lot within this new feature. Could we work only with this Peopletools monitoring utility rather than a third party to monitor the messaging ? Let’s have a look.
Here the main page:

Of course, the configuration must be set, for more details, please read my previous blog entry (it was for Peopletools 8.52, but still valid in Peopletools 8.53).
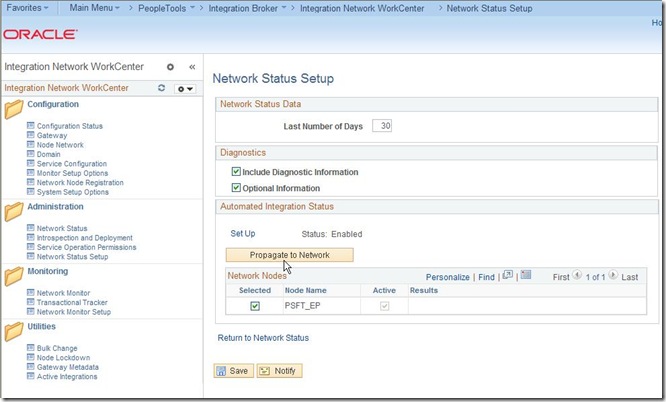
Go to the “Network Status Setup” (this has been added in Peopletools 8.53):

Go to the SetUp, fill up an email:

Optionally, include diagnosis and information.
You can propagate the setting to your remote node(s):

Now the test. I wrongly configured a message USER_PROFILE between my HR and EP systems, then create a new user on HR.
Few minutes later, the magic is done ! An email was dropped to my inbox:

Magic, but rather cryptic, isn’t it ?
Firstly, at this very moment, I do not really care that much the XML input.
Secondly, whether the email subject contains the source node (publisher), I have no idea about the target node (subscriber). I do not have more idea about the application which send my out this email. A dedicated email source must be set up front.
Thirdly, the message “Unable to find a routing corresponding to the incoming request message” is way too standard. We could expect much more, at least the same details as such we can find from within the front-end (see below).
Fourthly, there’s no link to the application. It would be much easier to have such link, give the credentials on a login page and being redirected to the Integration Network WorkCenter.
Last and not least, this email is sent every X minutes (X being the interval defined in the setup of automated integration) until you fix it, or until the limit is reached (last number of days). Should it not be enough to receive the error only once for the last X minutes ? Apparently not, by default it is checking all the messaging remaining in error every 5 minutes, and such for the last 30 days !
During my tests, I was like spammed…
Coming from Peoplesoft to automate its own processes, I would expect much more.
This email input is quite disappointing.
That said, keep the given transactionID and go to the transactional tracker in the front-end:

Go to the “Search Details”, and paste the previously TransactionID indentified to be in error from the email:

Now, we have a little bit more information about the message:

Going to the “View Error/Info”, we will retrieve the exact same error we got through the email:

Nothing really helpful on this page. The previous page is, to my point of view, more helpful, you have the external service name, the publishing node and the service operation. You already know there’s an error, so you should be able to fix it. Such information would be nice in the email.
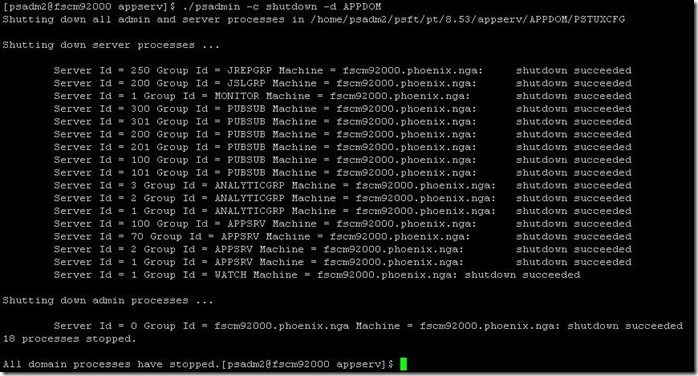
Now, to go further in my testing of this automated process, I’m shutting down the target messaging server (EP, the subscriber node).

And create a new user on HR, a message should be send to EP, at least a try. Obviously it shouldn't work.

Going to the monitoring overview, after a while, the message in “Retry” status:

Going to the details, it clearly states an error:

The error is quite obvious that time:

Unfortunately, I’ve never receive any email for that error ! I’m wondering if that’s because the status of the message is “Retry” and not “Error”.
It can remain endlessly in this status if I’m waiting for the email, unless I connect to the system and check it manually.
Again, disappointed.
Ok, I should read more carefully the RVP that I mentioned at the beginning :
”[…]Once configured, the Integration Network can monitor itself for *errors*.[…]” It’s clear enough, *error*… But do we not have an error here ? And what’s the meaning of the automation if I have to connect to the front end to check for the other “problematic” status (I mean not “done”) ?
Not regarding the automation of monitoring, but still about the Network Status.
Checking the status by default returns green icons (only if everything is well configured):

Go to the “Network Status Setup”:

As said earlier, on this page we can configure the automated monitoring, but there’s also diagnostics section. Check all of them out, save, and return back to the Network Status page. Check it again:

Now there’s “Warning” on every and each node (drag the mouse on over the triangles) ! We did not have any problem though !
Going to the details:

And to the diagnostics :

Well, fine with me, that can be useful to have details and diagnostics, but why, oh why is it a yellow triangle with warning ?!?!
In the end, my conclusion…
Here has been discussed about:
1. The automated email of Network Integration
2. The monitoring of messages (Retry status is really not monitored?)
3. The Network Integration Status, warning…
I would say none of these points are entirely satisfying my expectations:
1. I would give much more information in the Email content: less cryptic content, more information about the error, give a link to the application.
2. The status of messages to be monitored by the automatically processed should be configurable. Such an email to be send when a message is coming to a given status (checkboxes for the status would have been even better). I don’t really see any advantages of the automation if we have to connect and check for the other status like “Retry”, “Timeout” which are also kind of error.
3. Whether I can understand the need of diagnostic, it’s certainly not a warning ! To me, a warning must always be considered as an error. But here there’s no problem, it is just the result of a configuration setting.
That’s a nice try, but I tend to think this is only a first try to be improved in the next Peopletools release !
Enjoy,
Nicolas
Note: all the tests from the above have been made on the delivered Peoplesoft Appliances from April-2013, HCM9.2 and FSCM9.2 on Peopletools 8.53.02.
References:
1. To configure an email address on your sandbox, you can follow the instructions of Hakan Biroglu:
http://hakanbiroglu.blogspot.nl/2013/03/using-gmail-as-smtp-server-for.html
2. The online Peoplebooks have been greatly improved within the Peopletools 8.53, I used it for this blog entry:
http://docs.oracle.com/cd/E38689_01/pt853pbr0/eng/pt/tiba/intro_UsingtheIntegrationNetwork-388000.html

3 comments:
This is cool!
The link to configure email on sandbox is not working
Hakan moved his blog to a new host a while ago and I did not updated all the links. This is fixed.
Nicolas.
Post a Comment